How to Work Correctly with Implied Probability and Bookmaker Margin (Overround) in 2026

Implied probability is the quickest way to translate odds into a number you can compare across bookmakers, markets, and even your own model. The catch is that bookmaker prices are usually “loaded” with margin, meaning the implied probabilities in a market add up to more than 100%. If you treat those raw numbers as true chances, you will misprice outcomes, misread market moves, and overestimate value. This guide walks through the clean maths, the common traps, and a practical workflow you can use in 2026 to turn odds into usable, comparable probabilities.
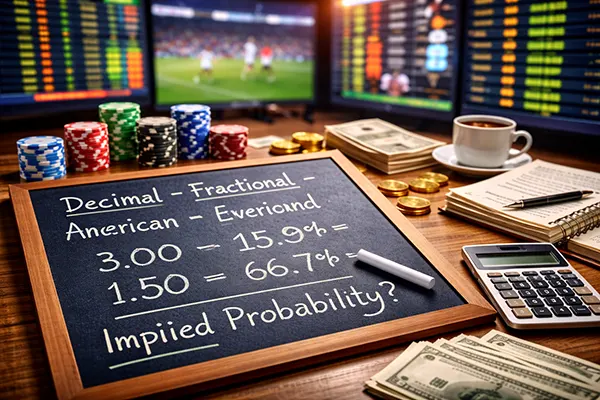
Implied probability: the clean conversions and what the number really means
At its simplest, implied probability is the probability that is “embedded” in the odds. With decimal odds, the conversion is straightforward: implied probability = 1 / decimal odds. So odds of 2.50 imply 1/2.50 = 0.40, or 40%. This is not a prediction that the outcome will happen 40% of the time; it is the price signal expressed as a probability, before you adjust for margin, risk management, and market context.
For fractional odds (common in the UK), you can either convert to decimal first or use a direct formula. If the price is A/B, decimal odds are (A/B) + 1, so implied probability becomes 1 / ((A/B) + 1) which simplifies to B / (A + B). For example, 6/4 equals 2.50 in decimals, and the implied probability is 4/(6+4) = 40%. This is a useful shortcut when you are scanning prices quickly.
For American odds, it helps to remember there are two cases. If odds are negative (e.g., -150), implied probability = 150 / (150 + 100) = 60%. If odds are positive (e.g., +200), implied probability = 100 / (200 + 100) = 33.33%. Converting everything into one probability scale is not about being “more scientific”; it is about making sure you compare like with like, especially when different bookmakers display odds in different formats.
Quick sanity checks that prevent expensive mistakes
First, always confirm you are working in the right market structure: two-way (win/lose), three-way (home/draw/away), or multi-runner (outrights). People often apply a two-way habit to a three-way market, then wonder why their numbers feel “off”. The formula is the same, but you must apply it to every selection and only then assess the market total.
Second, check for rounding and display issues. Odds are usually displayed with rounding, so implied probabilities won’t be perfectly precise, especially in tighter markets. If you are comparing margins between bookmakers, calculate using the full odds provided (as displayed) and accept that tiny differences may be rounding rather than a real pricing edge. The bigger errors come from mixing formats or forgetting to include all outcomes, not from a 0.1% rounding drift.
Third, distinguish between a price move and a probability move. A shift from 2.00 to 1.90 is not a “5% increase in probability” unless you calculate it. The implied probability changes from 50.00% to 52.63%, which is a 2.63 percentage-point move, not 5. This distinction matters if you track market steam, set alerts, or audit how your own prices compare to the market over time.
Bookmaker margin (overround): how it’s created and how to measure it correctly
Bookmaker margin is the built-in cushion that allows the book to be profitable in expectation. In probability terms, it shows up as an overround: the sum of implied probabilities across all outcomes exceeds 100%. In a two-way market, if Team A is 1.80 (55.56%) and Team B is 2.10 (47.62%), the total is 103.18%. That extra 3.18% is the overround, often called the margin, vig, or juice.
Measuring overround is simple: convert each price to implied probability, sum them, then subtract 1 (or 100%). Using the example above, margin ≈ 1.0318 − 1 = 0.0318, or 3.18%. Do the same in a three-way market: Home 2.40 (41.67%), Draw 3.40 (29.41%), Away 3.10 (32.26%) sums to 103.34%, meaning a 3.34% overround. This gives you a quick way to compare how “expensive” a market is across bookmakers or across bet types.
In 2026, you will still see margin vary by sport, league, market depth, and customer segment. High-liquidity, headline events often run tighter books, while niche props and lower-tier leagues tend to carry larger margins. That does not mean niche markets are “bad”; it means you must treat raw implied probability as a house-influenced number and adjust it before you use it for modelling, fair pricing, or value detection.
What margin is not: three myths to drop
Myth one: “Margin equals the bookmaker’s guaranteed profit.” It does not. Margin is an expected edge if prices are accurate and the book balances reasonably, but real profitability depends on risk, liabilities, sharp action, promotions, and how the operator trades. As bettors, we treat margin as a cost embedded in the price, not as a promise about the operator’s bottom line.
Myth two: “Lower margin always means better value.” Lower margin reduces your friction, but the best price on a single selection can come from a higher-margin bookmaker if they are shading that outcome differently. Your job is to compare the selection’s price to a fair estimate, not to shop purely by headline overround. Overround is a market-wide measure; value is selection-specific.
Myth three: “You can ignore margin if you only bet occasionally.” Even small margins compound. If you are doing any kind of long-run evaluation—tracking ROI, benchmarking picks, comparing your model to the market—you need margin-free probabilities. Otherwise, you systematically underestimate how strong a price needs to be to beat the market after costs.
Removing the margin: normalising probabilities and turning them into fair odds
The practical fix is normalisation: convert all outcomes to implied probabilities, then divide each by the total probability sum. This strips out the overround and gives you “fair” probabilities that add to 100%. Using the earlier two-way example, totals are 55.56% + 47.62% = 103.18%. Normalised probability for Team A becomes 55.56 / 103.18 = 53.86%, and Team B becomes 47.62 / 103.18 = 46.14%. Now the pair sums to 100% and can be compared fairly to a model, an exchange, or another bookmaker.
Once you have fair probabilities, you can convert back to fair odds by taking 1 / probability (in decimals). Team A at 53.86% corresponds to fair odds of about 1.857; Team B at 46.14% corresponds to about 2.167. Notice how this differs from the offered prices (1.80 and 2.10). That gap is the cost of the book. If you are price-shopping, you care about how your assessed probability compares to the fair probability, not to the raw implied probability.
Normalisation is not the only way to remove margin, but it is the most transparent and widely applicable. It works cleanly for two-way and three-way markets, and it extends to multi-runner outrights as long as you include every priced runner. In practice, your biggest challenge is completeness: if the market has “field” or “any other” selections and you ignore them, your total will be wrong and your normalised probabilities will be distorted.
A repeatable 2026 workflow for pricing, comparison, and decision-making
Step 1: standardise your odds format and record the market type. Convert all prices to implied probabilities outcome-by-outcome. Step 2: calculate the probability sum and the overround. If the total is close to 100%, you are likely dealing with an exchange-style price, a tight promo market, or a display/rounding quirk—either way, note it before you proceed.
Step 3: normalise to get fair probabilities and convert them into fair odds. Step 4: compare your own assessed probability to the fair probability, not to the bookmaker’s raw number. A simple decision rule is: you only have a positive edge if your probability is meaningfully higher than the fair probability once you account for uncertainty and staking discipline. If your edge is tiny and your estimate is noisy, you are effectively paying margin for variance.
Step 5: keep an audit trail. Save the original odds, implied probabilities, overround, and fair probabilities. Over time, this helps you see which markets are consistently expensive, where your model deviates from the market, and whether your process is stable. It also prevents a common self-deception: remembering only the times your price disagreed with the market and was right, while forgetting the quieter, more frequent misses.